




What is a histogram?
Let's say you're really getting into photography and getting to know more and more about your camera and its settings. But what's that graph on the screen of your camera when you've captured a photo? That's the histogram and we're going to explain what it shows and how you can use it to your advantage below. After reading this page, you'll know even more about what's possible with your camera!
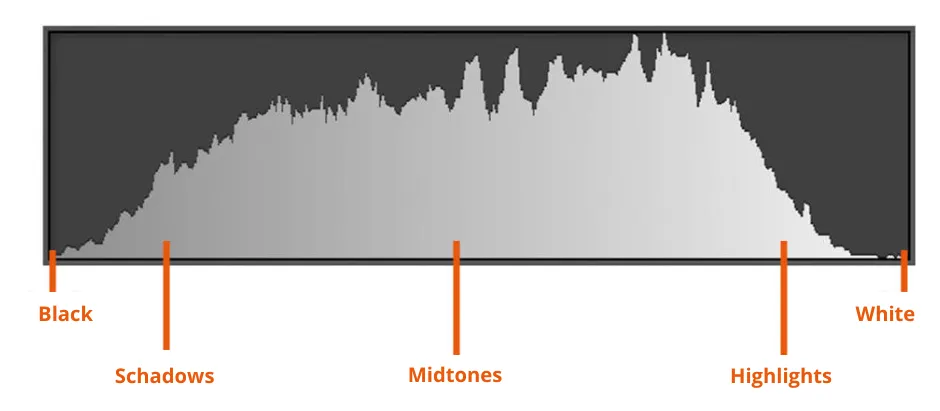
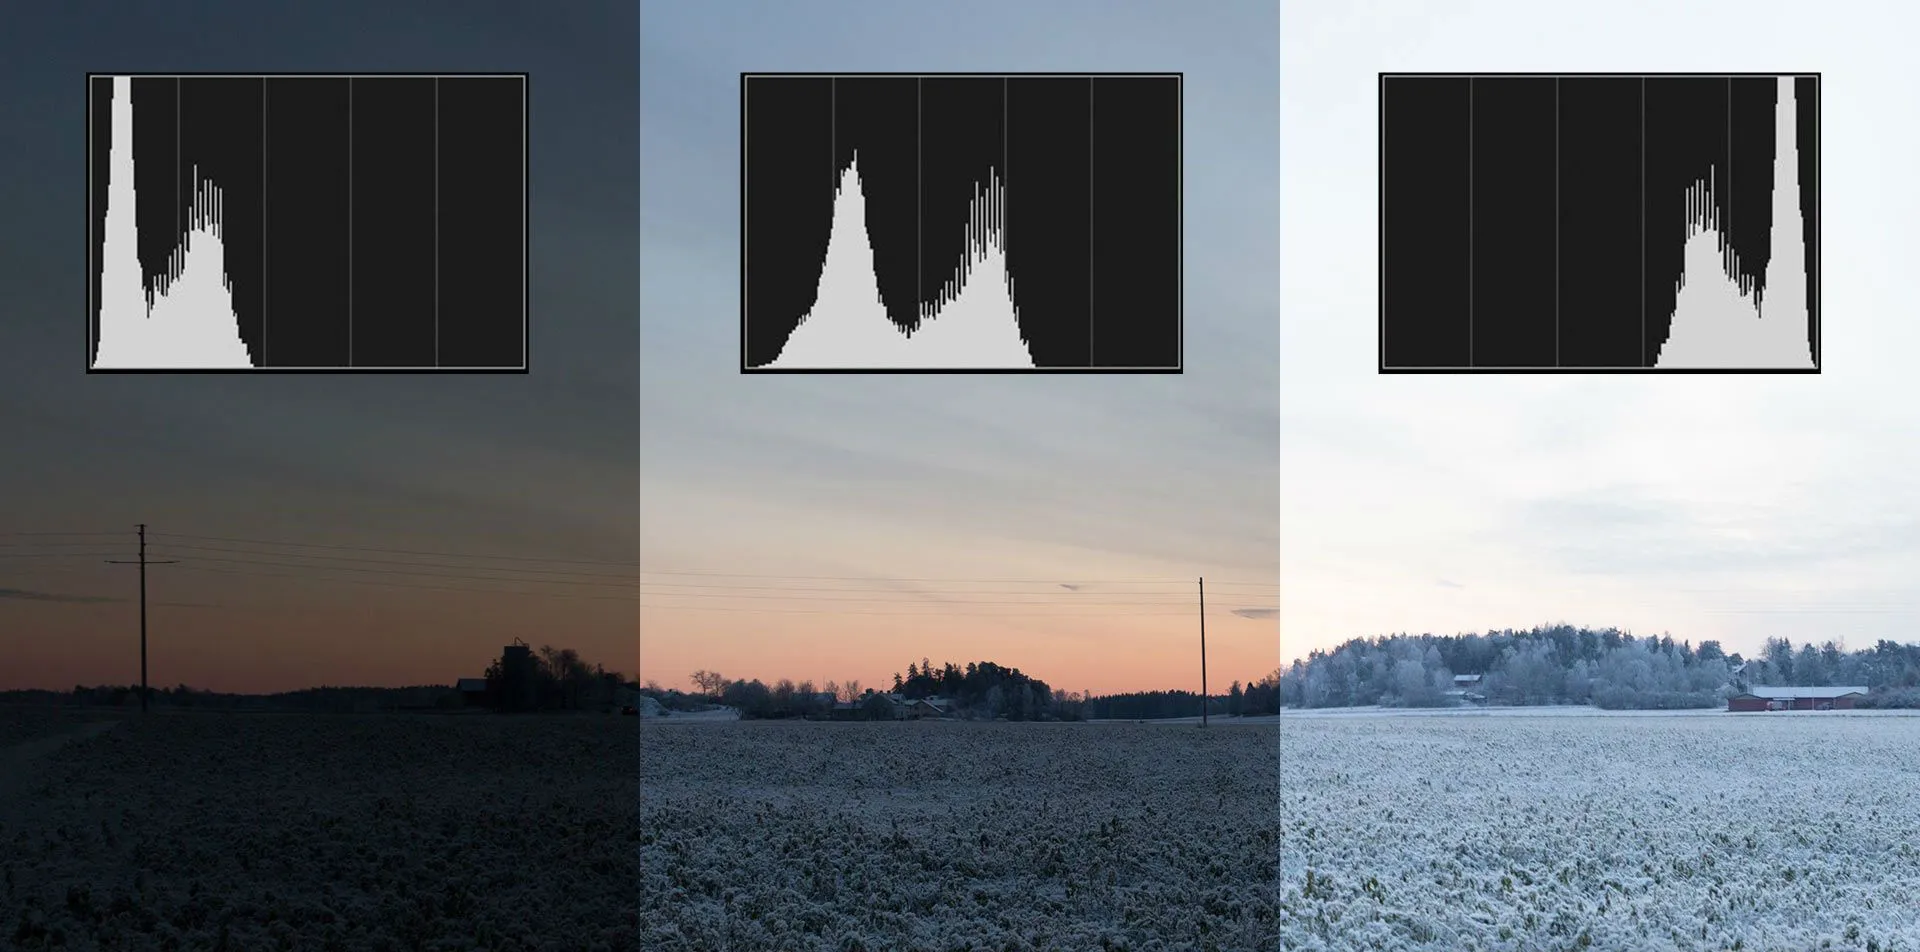
The histogram is found on the screen of your camera and looks like a kind of graph. On this graph, you can see if a captured photo is properly exposed. The histogram shows how strong the light intensity of the photo is, with dark tones, light tones and all tones in between. On the left-hand side of the histogram, you'll find the dark tones and the light tones on the far right. When you see high peaks in your histogram, it means that there is more information for that tone in the image. A histogram doesn't literally represent the colours but rather the brightness of each colour. For example, dark blue takes on a darker hue and will be displayed more on the left. And light blue will be rendered on the right side because it is a light shade.